


Pull from Parabola Table
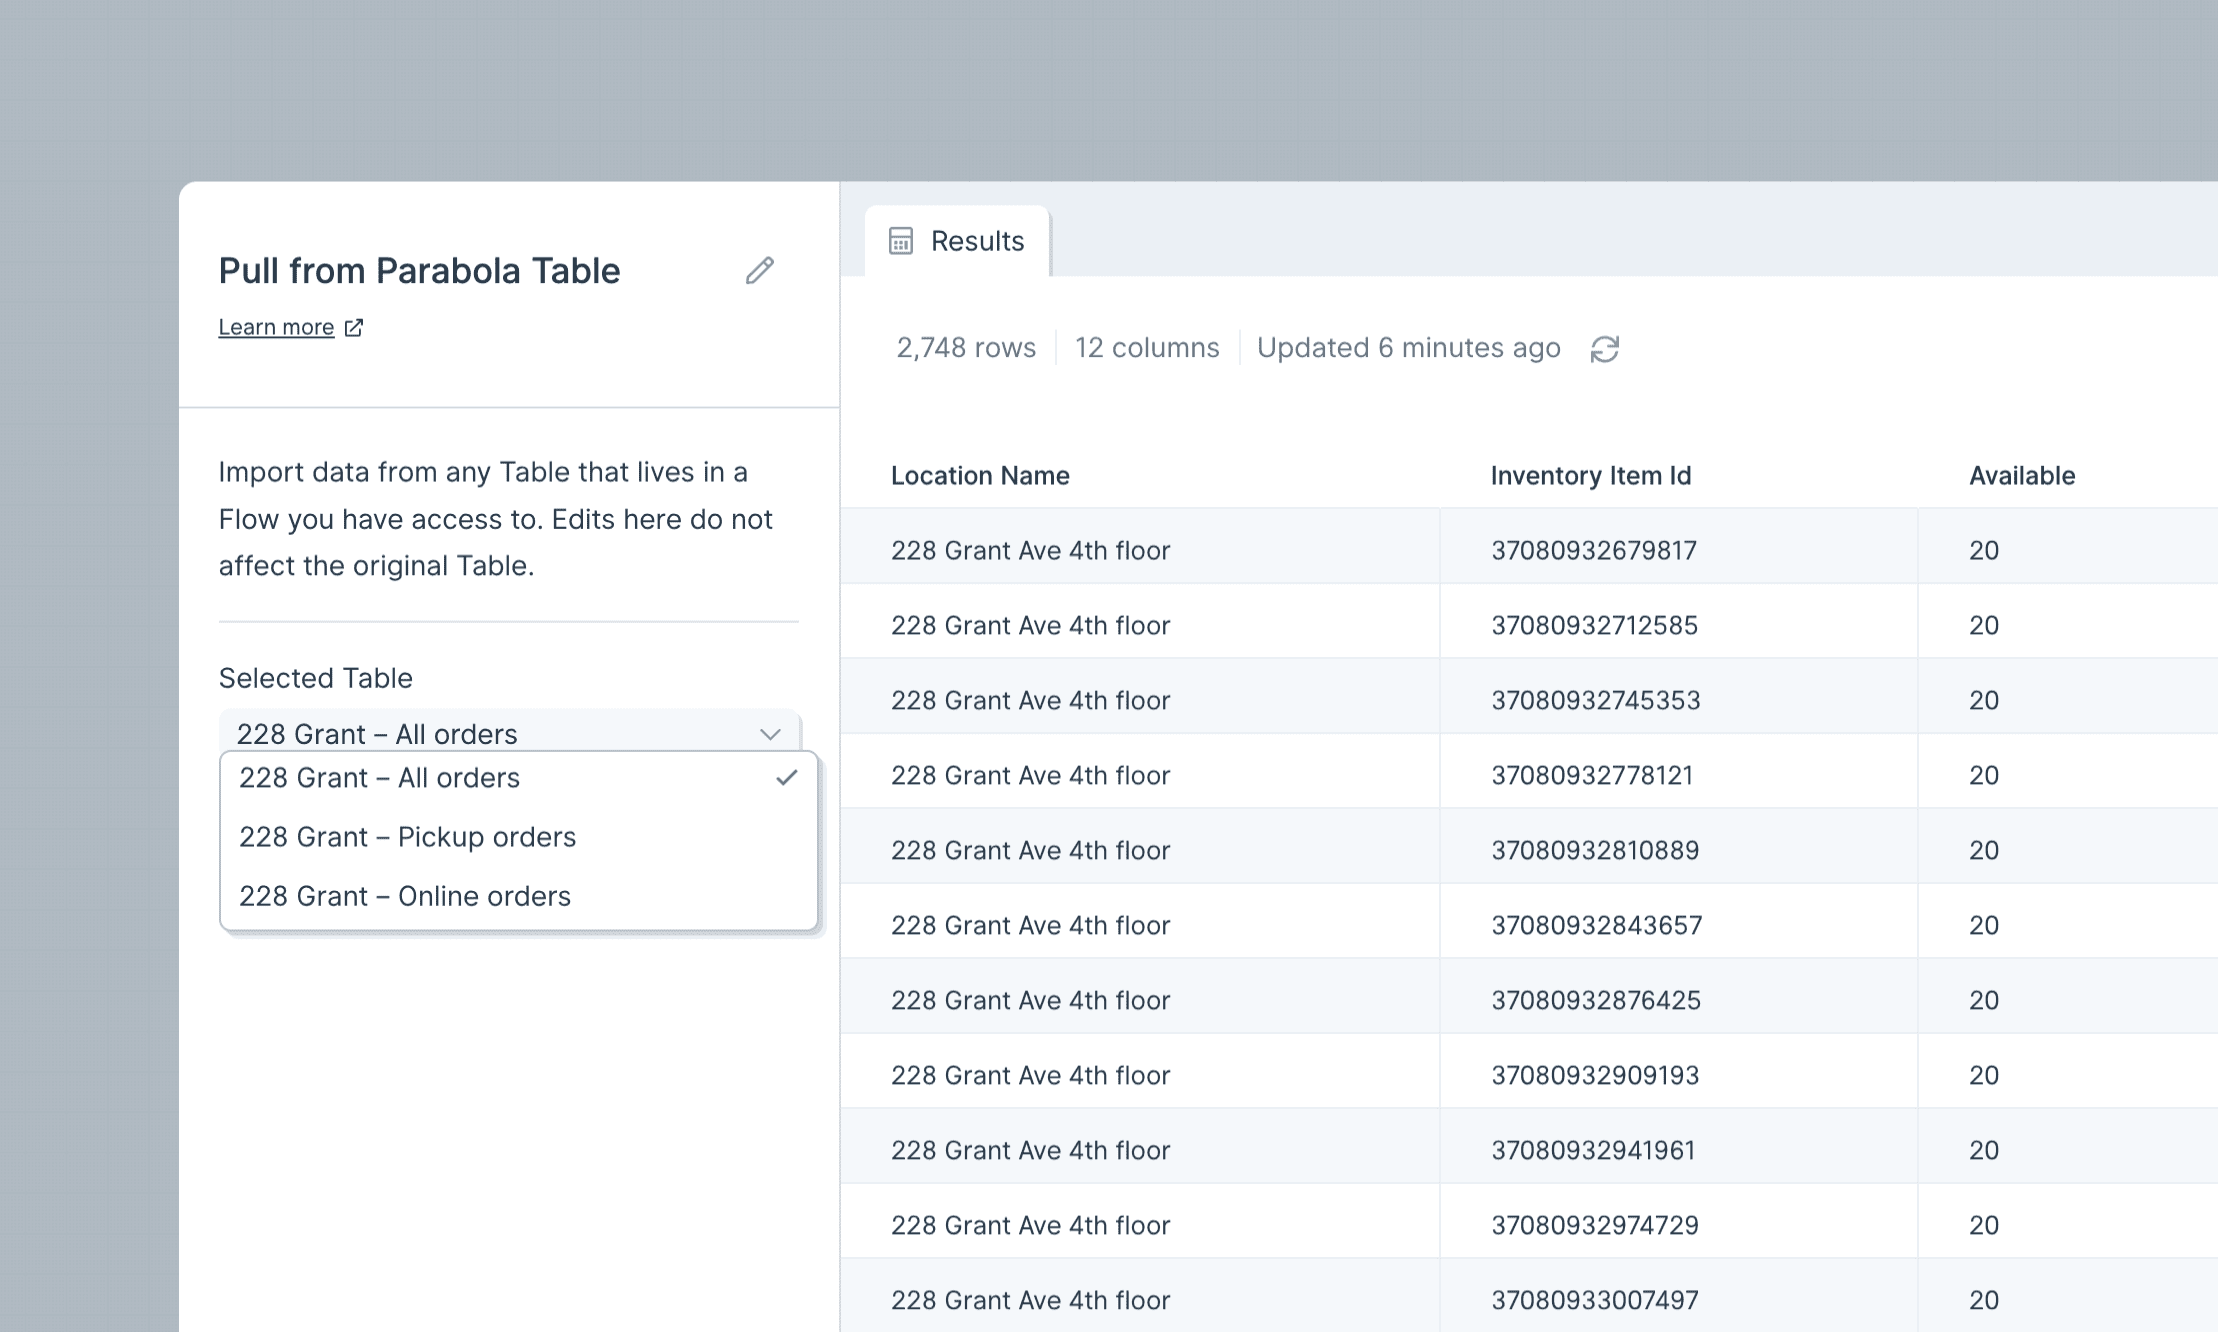
The Pull from Parabola Table step is a source step used to pull data from a Parabola Table that you have access to. If you are an Editor or Viewer on a Flow, any Parabola Tables on that Flow will be available to be pulled in as a data source using this step.
Settings
The dropdown options for Tables to import will be located on the left-hand side. Tables that you have access to will be listed in the dropdown options. This step can access any Table in your Parabola account that you are authorized to access (whether as Viewer, Editor or owner).
Helpful Tips
This step pulls the base data in your Parabola Table. Views applied on to your table, such as filters, sorts, aggregations, groups and visual formatting will not show up in this step.
If you do not see your Parabola Table in the dropdown, check to make sure the Allow other Flows to pull data from this table option is enabled on your Send to Parabola Table step.
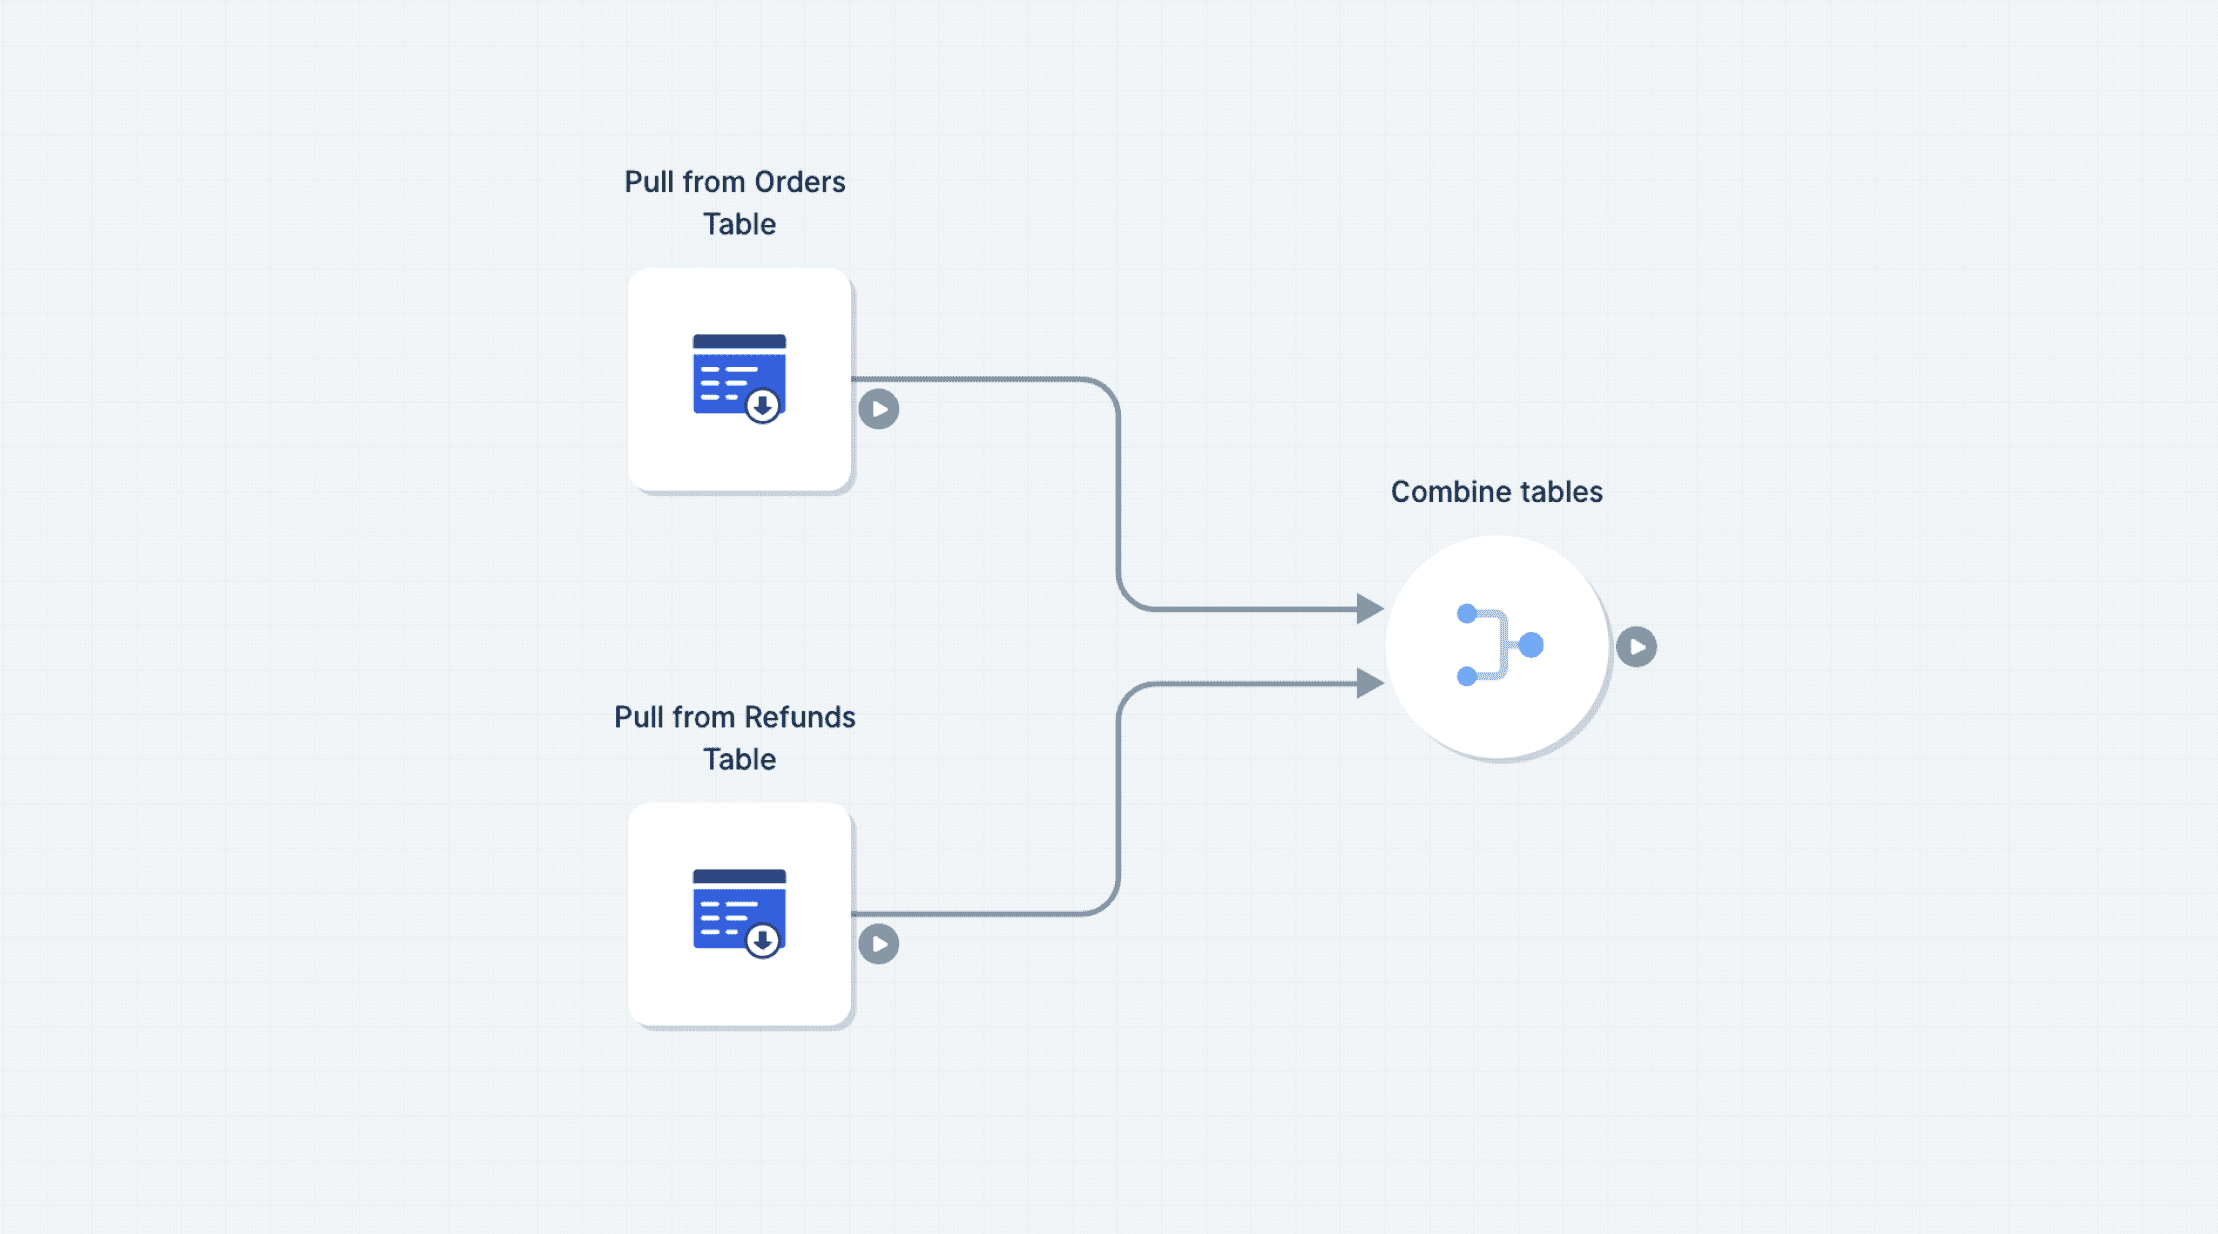
If you need to bring in multiple Tables, use multiple Pull from Parabola Table steps to bring in the data. Then combine the dataset using a Stack tables or Combine tables step.
Limitations: when working across multiple Flows, the Pull from Tables step will only pull from a Table that has been published on a Flow with a successful run. When working within the same Flow, you can also pull from a draft (unpublished) table.
Related Recipes
Send to Parabola Table
The Send to Parabola Table step is a destination step that lets you send your dataset to a Parabola Table, which appears on the published page of your Flow. Data sent to that table will be visible to anyone with access to that Flow (Viewer, Editor or Owner).
Settings
- After you connect your Flow to this export step, it will show a preview of the Table data. You must give your Table a name on this step (and you can edit the name from here at any time).
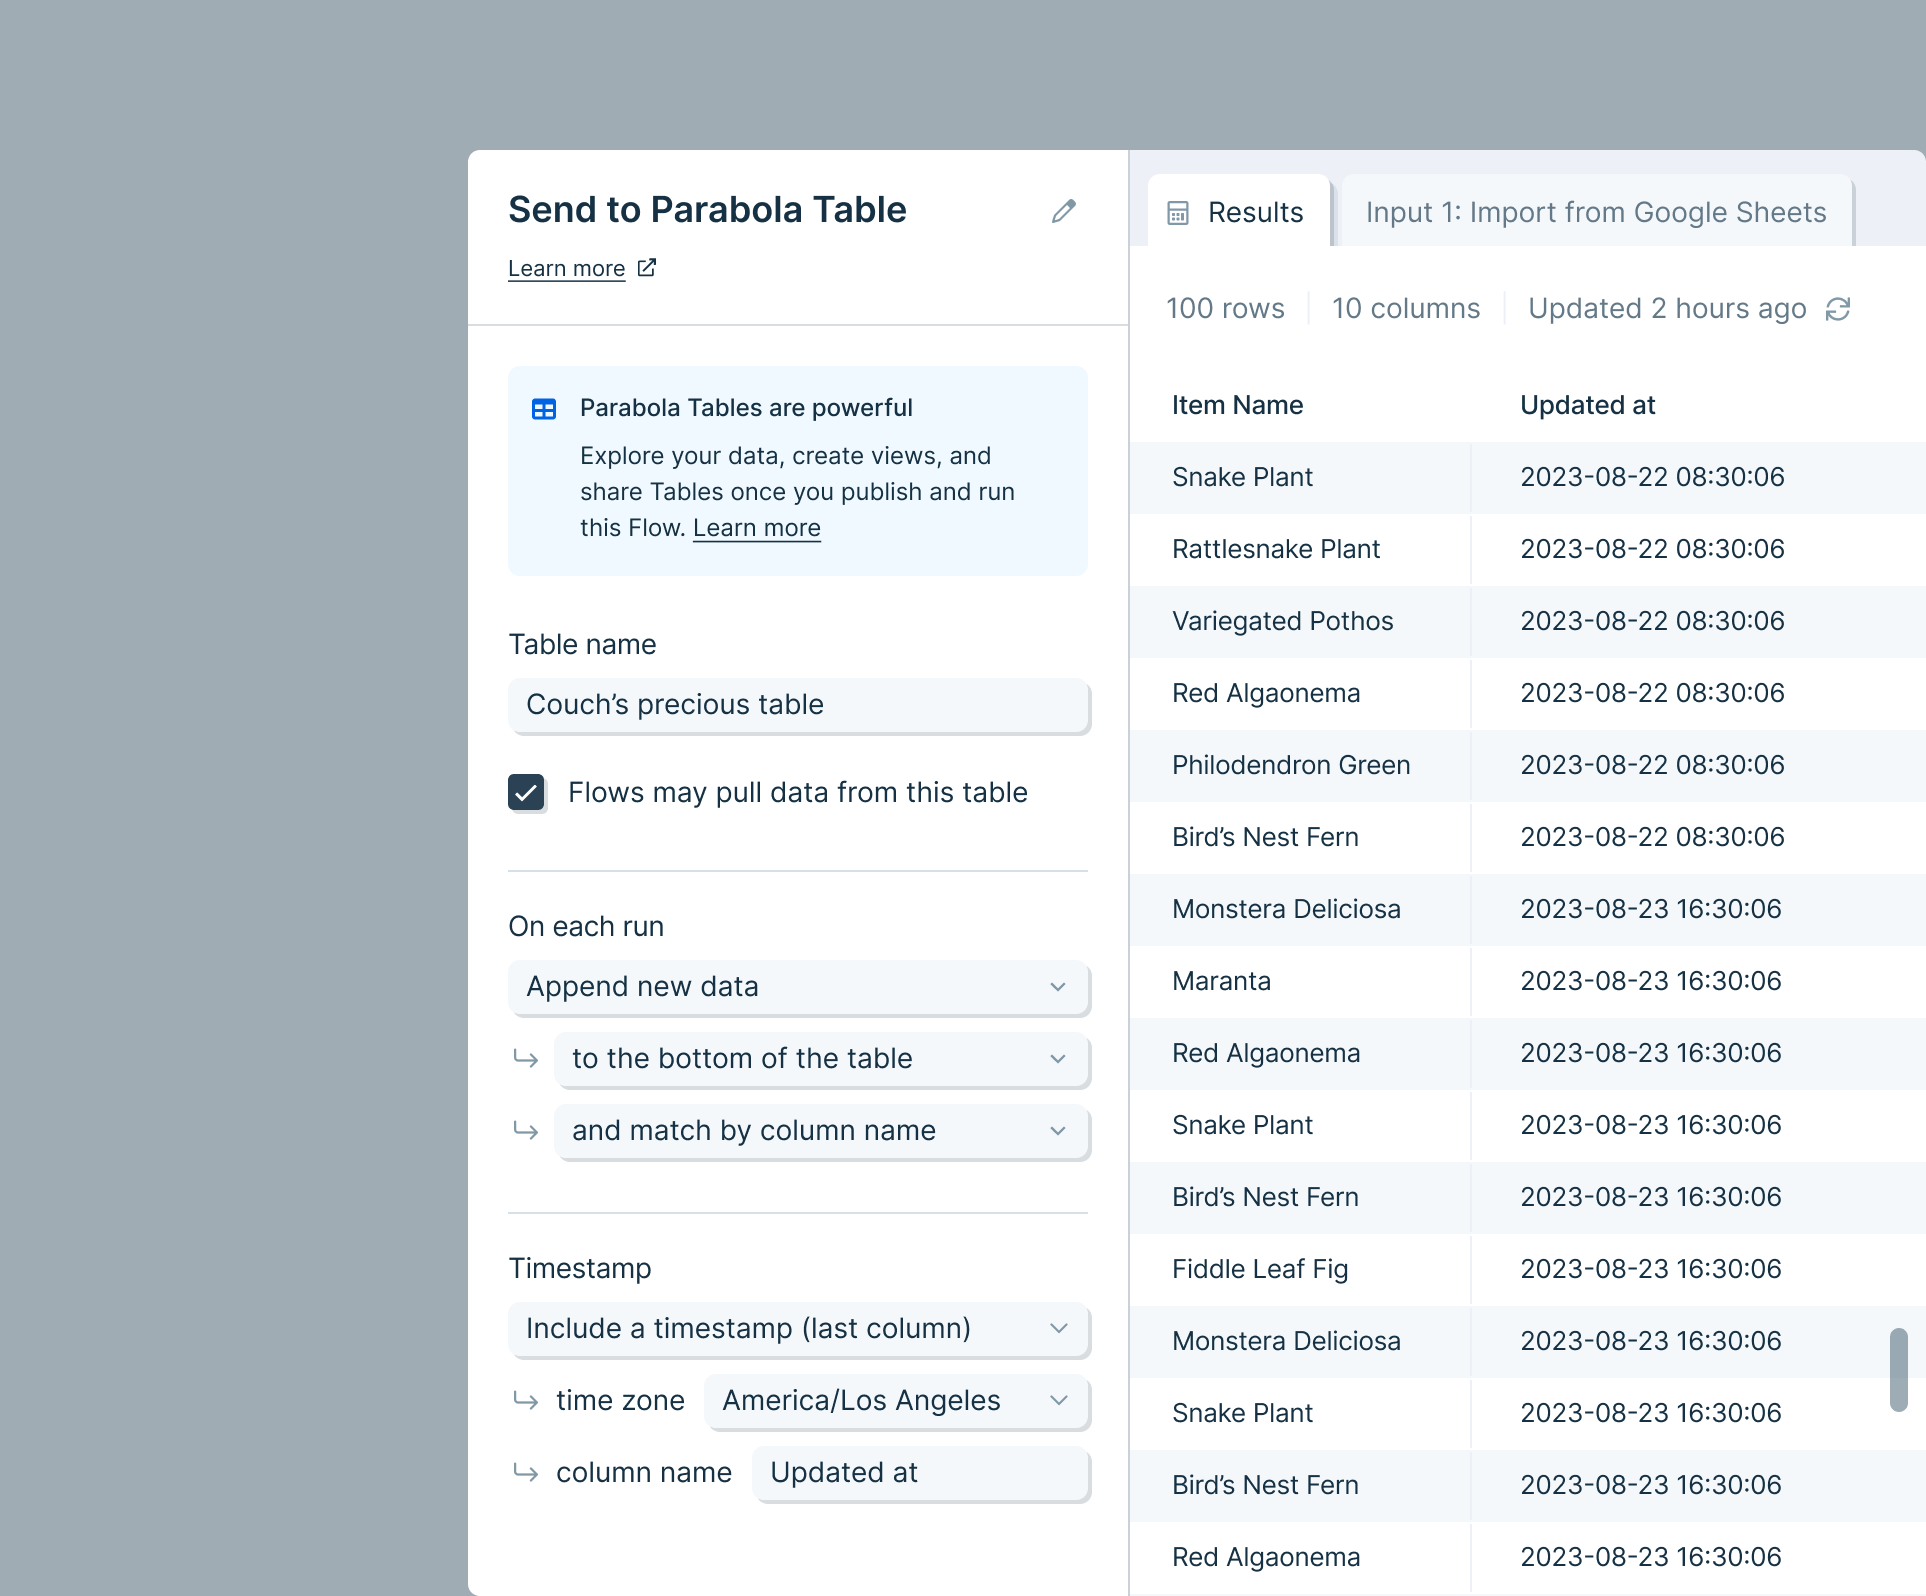
- By default, the Allow other Flows to pull data from this table option will be checked. When checked, teammates with any access to this Flow will be able to use this Table as source data in other Flows (using a Pull from Parabola Tables step). To prevent other Flows from pulling this Table, disable this option. Tables will still be visible in the Flow’s Live page, and can be pulled within the same Flow.
- Choose how the data will be added to the Table. Data can be overwritten on each run, appended to the bottom or top (prepend), or updated based on certain values (upsert).
Overwrite the table
- With this option, each run of your Flow will completely replace the data in the Table
Append new data
- With this option, each run of your Flow will add new rows either below, or above, the existing rows in the Table. All rows that are sent to this step will be added to the table
- Choose to match the columns in the input data in the step to the table by matching the position or name of each column in the table
- Optional: you can include a timestamp that indicates when each row was added to the table
Update existing rows
- With this option, each run of your Flow will attempt to update matching rows within the table
- Rows will be matched based on the combination of values in all columns selected. If duplicate matches exist, the step will error when the Flow runs. All matching column name must be present in both the data in the step and the table, and must be exact matches by name
- If a match is not found for a particular row in the step, it can be appended to the bottom of the table or discarded
- Optional: you can include a timestamp that indicates when each row was last updated
Published Flow
Once you publish and run your Flow, the Table on the published page will populate and update. When those tables are visible, you can sort, filter, group, and aggregate by applying view settings, then saving those settings as a Table View. Create views that look like tables, charts or featured metrics. More info on how to configure Table Views here.
.png)
The published page will show as many Tables as are generated by your Flow — so you can display multiple Tables at any given time.
Running another Flow after updating a Table
Use an arrow to connect this step to other steps in a sequence. For example, you can connect this step to the Run another Flow step to first send data to a Table and then run a Flow that pulls data from that Table.
.png)
Helpful Tips
Security: the data you send through this step is stored by Parabola. We store the data as a convenience, so that the next time you open the Flow, the data is loaded into it. Your data is stored securely in an Amazon S3 Bucket, and all connections are established over SSL and encrypted.
Your Table’s content is never discarded. To remove the data, you will need to delete the step from both Draft and Published versions of the flow (or delete the entire Flow).
You can keep your published Flow page tidy by setting up Table Views! Instead of exporting filtered versions of your data to many tables, export the entire dataset to a Parabola Table, and then add filters within views on that table (on the published page).
Limitations: Parabola Tables will be limited to our current cell count limitation (described here).
At launch, you can use unlimited Parabola Tables at no extra charge to your team. After a beta period, we’ll move to a usage-based model for Parabola Tables data storage. (You will not be charged retroactively for usage during the beta period.)